

The Moving Average (Simple And Exponential) - Theory, Math, And Implementation In JavaScript


The moving average is a method to analyze data by creating a series of averages (from subsets ) of it.
Especially in finance, the moving average is used a lot to give buy or sell signals for stocks. And we will learn how it works and implement it in JavaScript.
The Moving Average (MA)
As you have already read, the moving average is a method to analyze data. It is, more specifically, usually used to identify trends, especially in finance, but you can also apply it to house prices, or else.
The moving average is calculated over a specific time-span which is customizable to your liking. You can calculate it for 10 days, 20 days, etc.
Common intervals are:
- 10
- 20
- 50
- 100
- 200
with a variable unit (minutes, hours, days, etc.).
There are also multiple types of moving averages:
- Simple Moving Average (SMA)
- Exponential Moving Average (EMA)
- Smoothed Moving Average (SMMA)
- Linear Weighted Moving Average (LWMA)
that, starting from only calculating an average over a specific time-span also count in a weight, to pay more attention to recent prices, or chart movements.
All methods have one thing in common: They are used to cut out noise from a time-series (prices, for example). Because many movements of the data points are often shortly negated after. The moving average basically flattens the curve a little and puts the focus on the overall trend, instead of individual movements.
In this article, we will cover the simple and exponential moving average.
Example Scenario and Setup
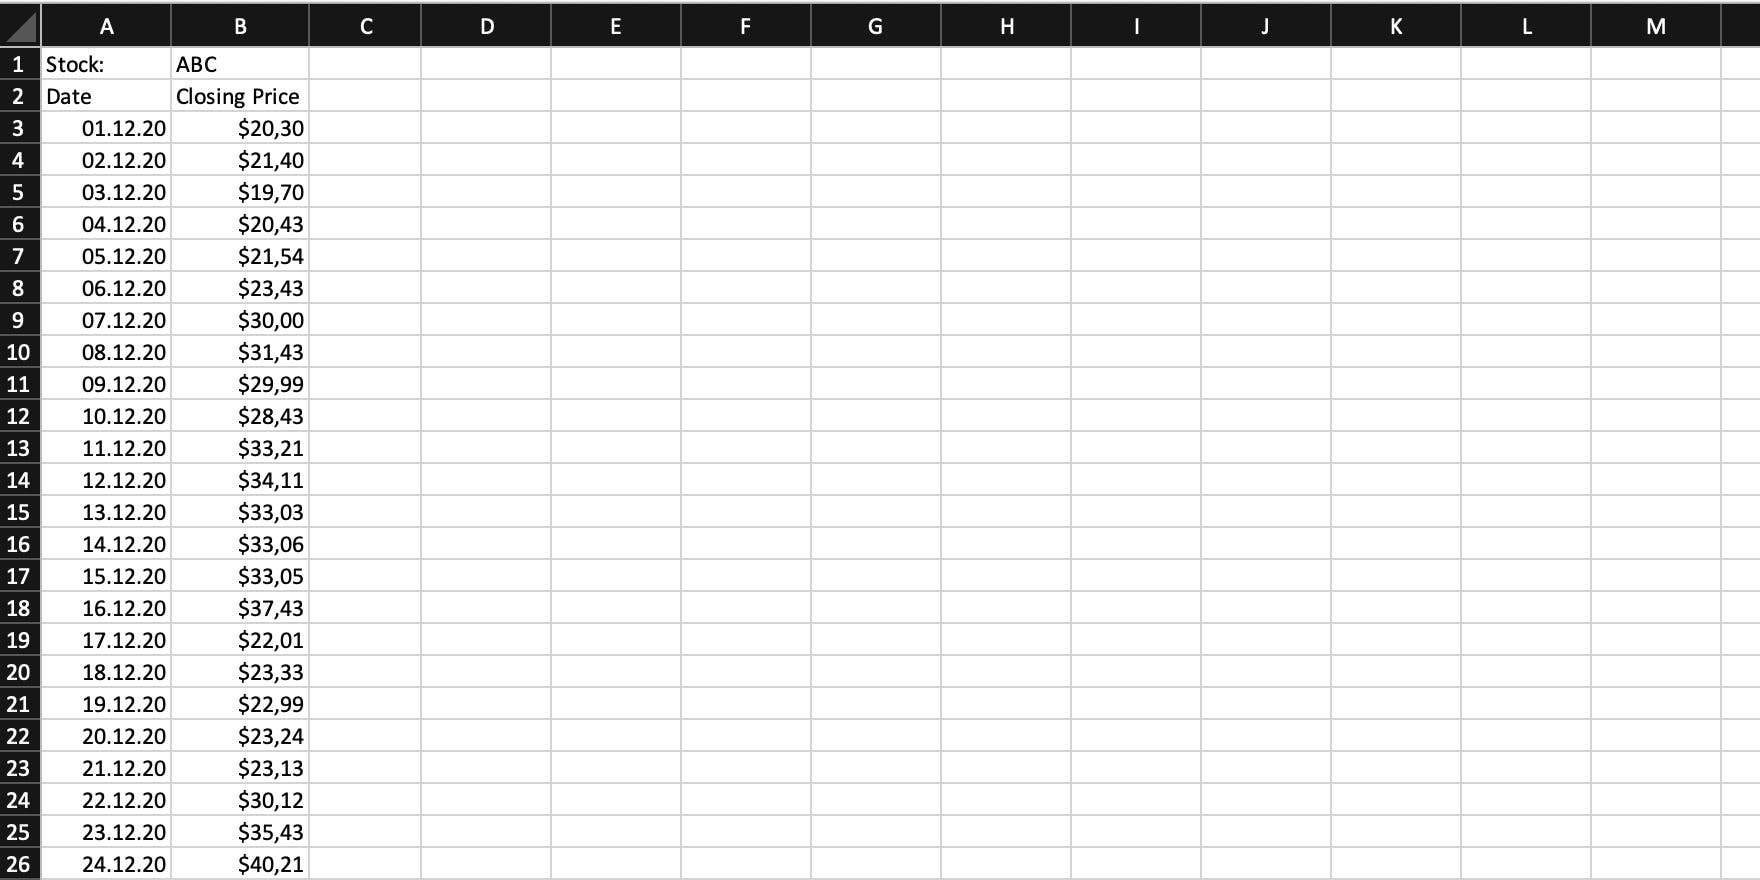
I'll use Excel to first show you the math and to explain the method to you in more detail before we'll go into the implementation.
Our scenario includes a look at the closing prices of company ABC.
The closing price is the price that a stock has when the exchange closes for the day. It's often used in finance, as it basically is the result of all trade that went on that day.
You could also work with the daily highs or lows. The moving average doesn't care about the value you use, as long as you use it persistently. It doesn't make much sense to use the closing price for day one, but then the daily high, and then the closing price again, etc. This could lead to some very wrong signals in your analysis.
The Simple Moving Average (SMA)
As its name already suggests, the simple moving average is a simple form of a moving average. To be precise, it is the simplest form of an MA that you can calculate.
You can see the formula for it below.
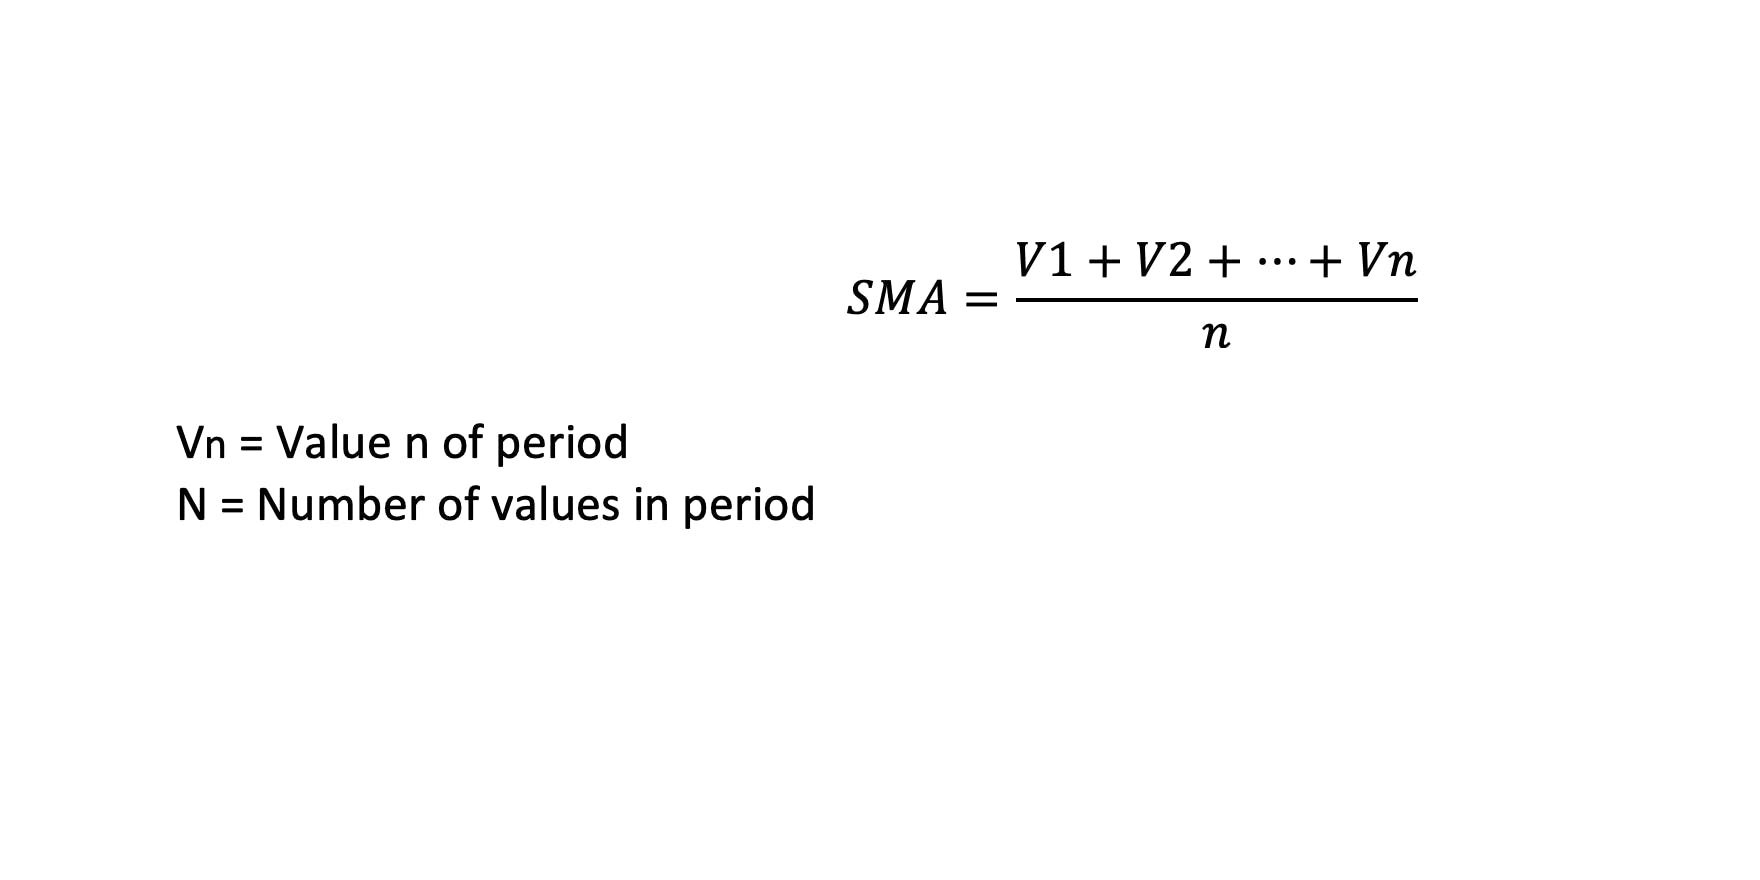
The first thing to do is to choose a window, e.g. 5 days. You then start with the latest price, choose the n-1 (4 in this case) prior prices, and calculate an average for them. Then, you go back one day and do the same again, basically creating an MA for every day. Do this over and over again, until you have at least a few values.
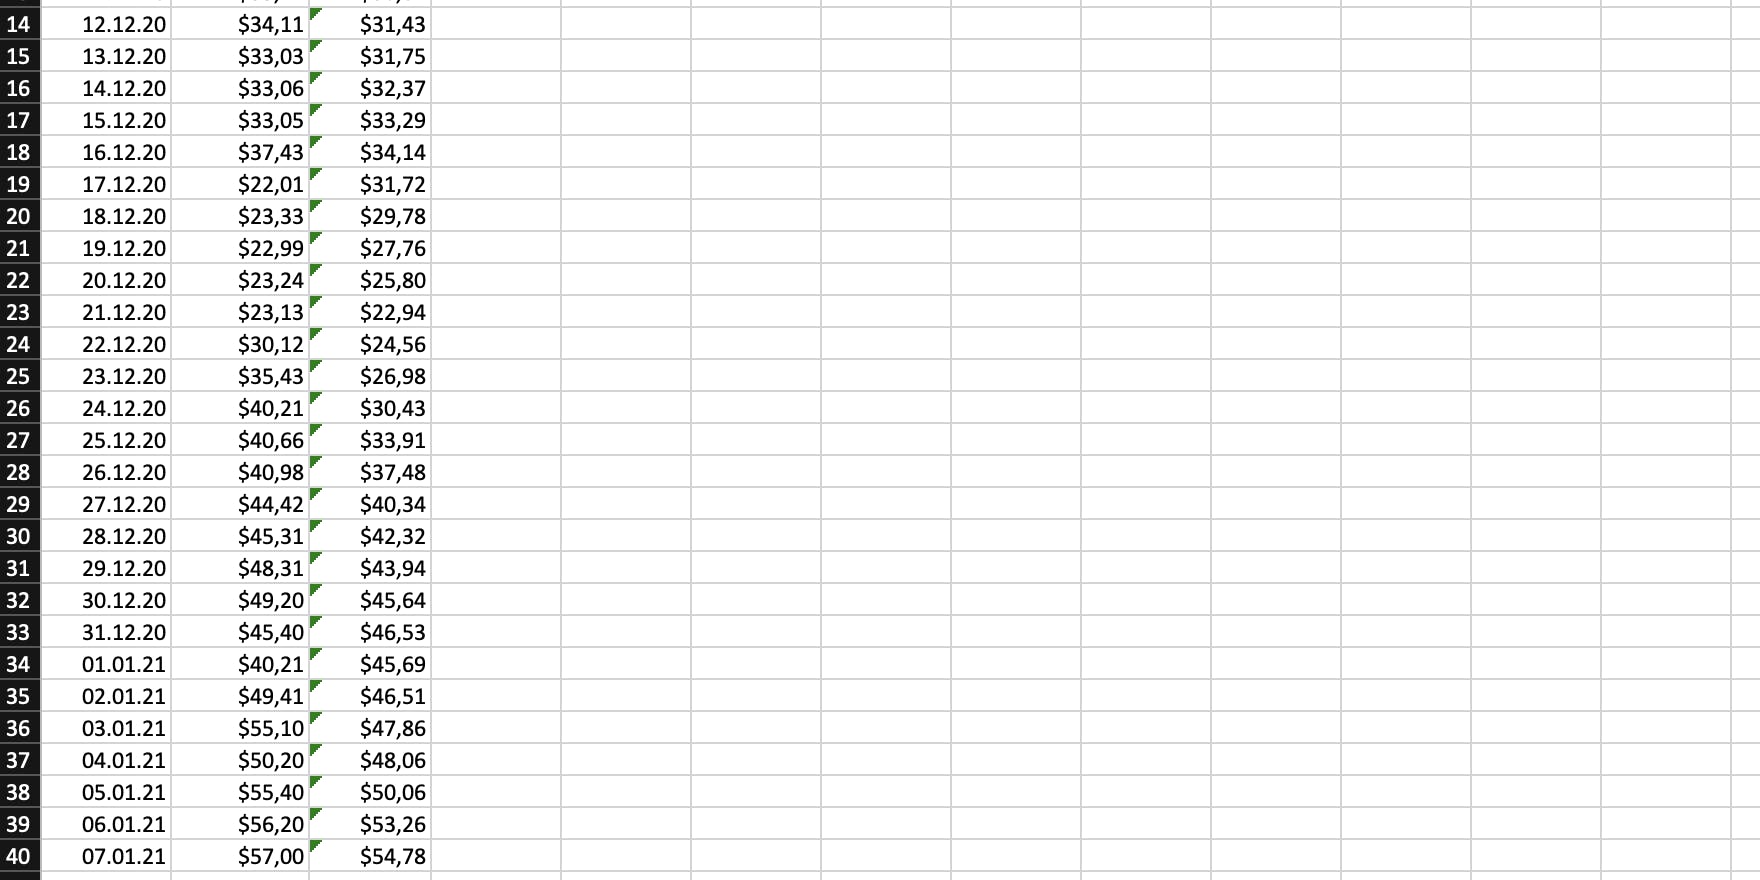
There is, however, one thing you have to keep in mind: If you have a window of w, you won't be able to calculate the SMA for the first w - 1 values, as there are not enough values in the history, already (see the image below).
E.g.: For 5 days, the first 4 days won't have an SMA.
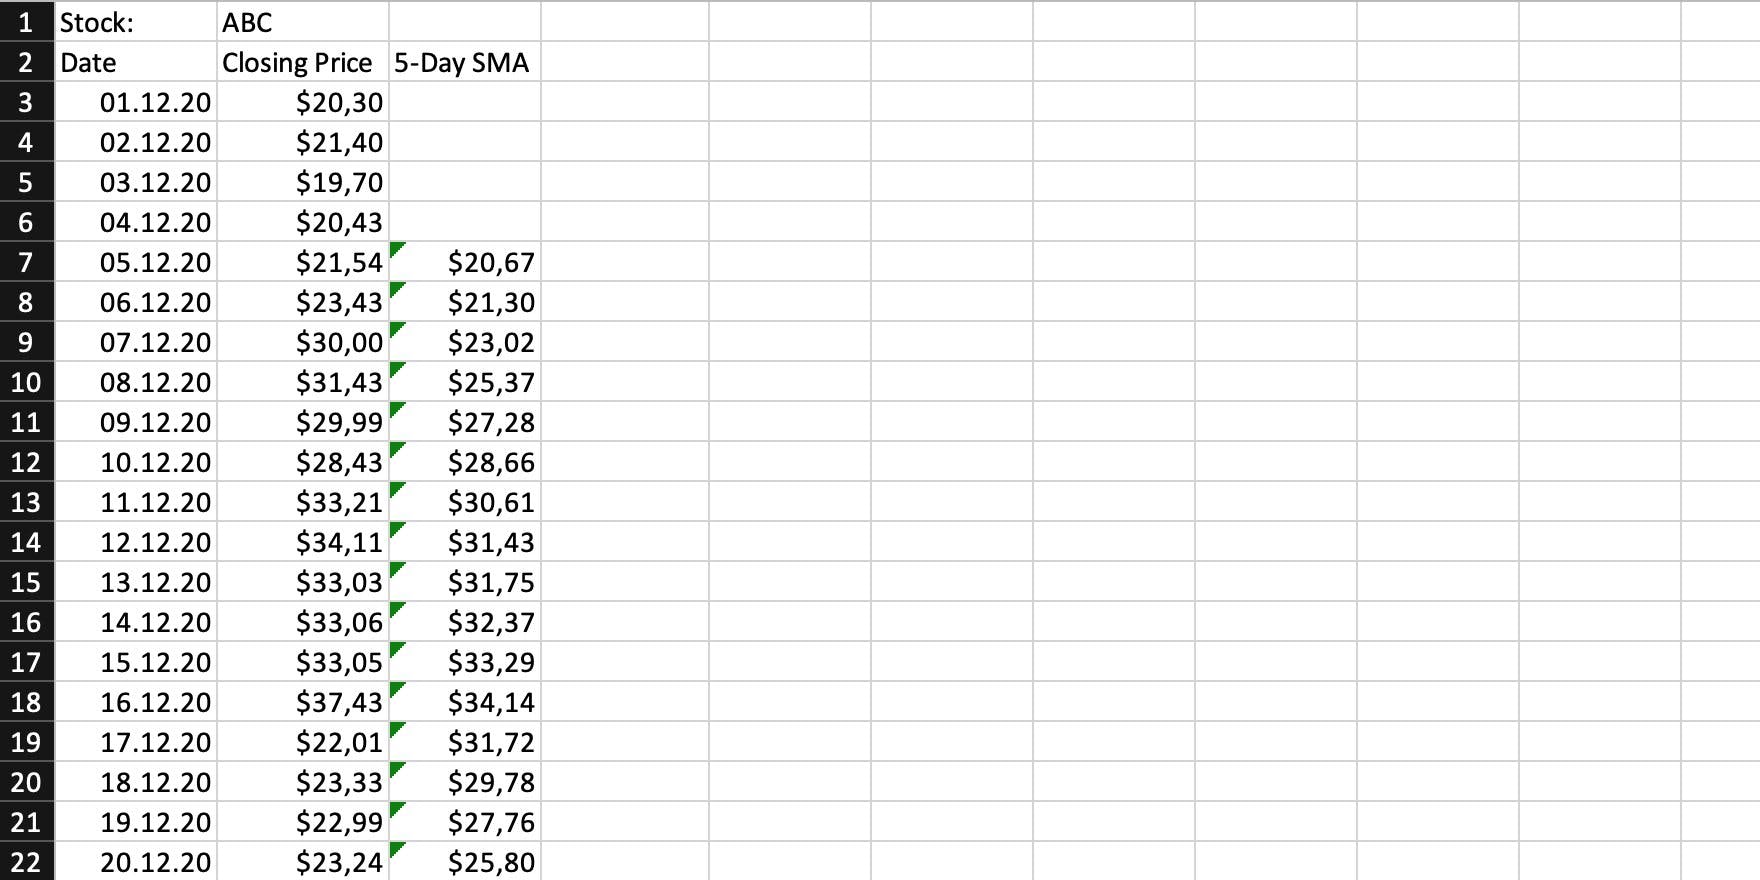
When you're done, the SMAs can be interpreted. Either by some automatism or by you, looking at a chart, like the one you see below. The blue line shows the closing prices of company ABC's stock. The red line shows the moving average.
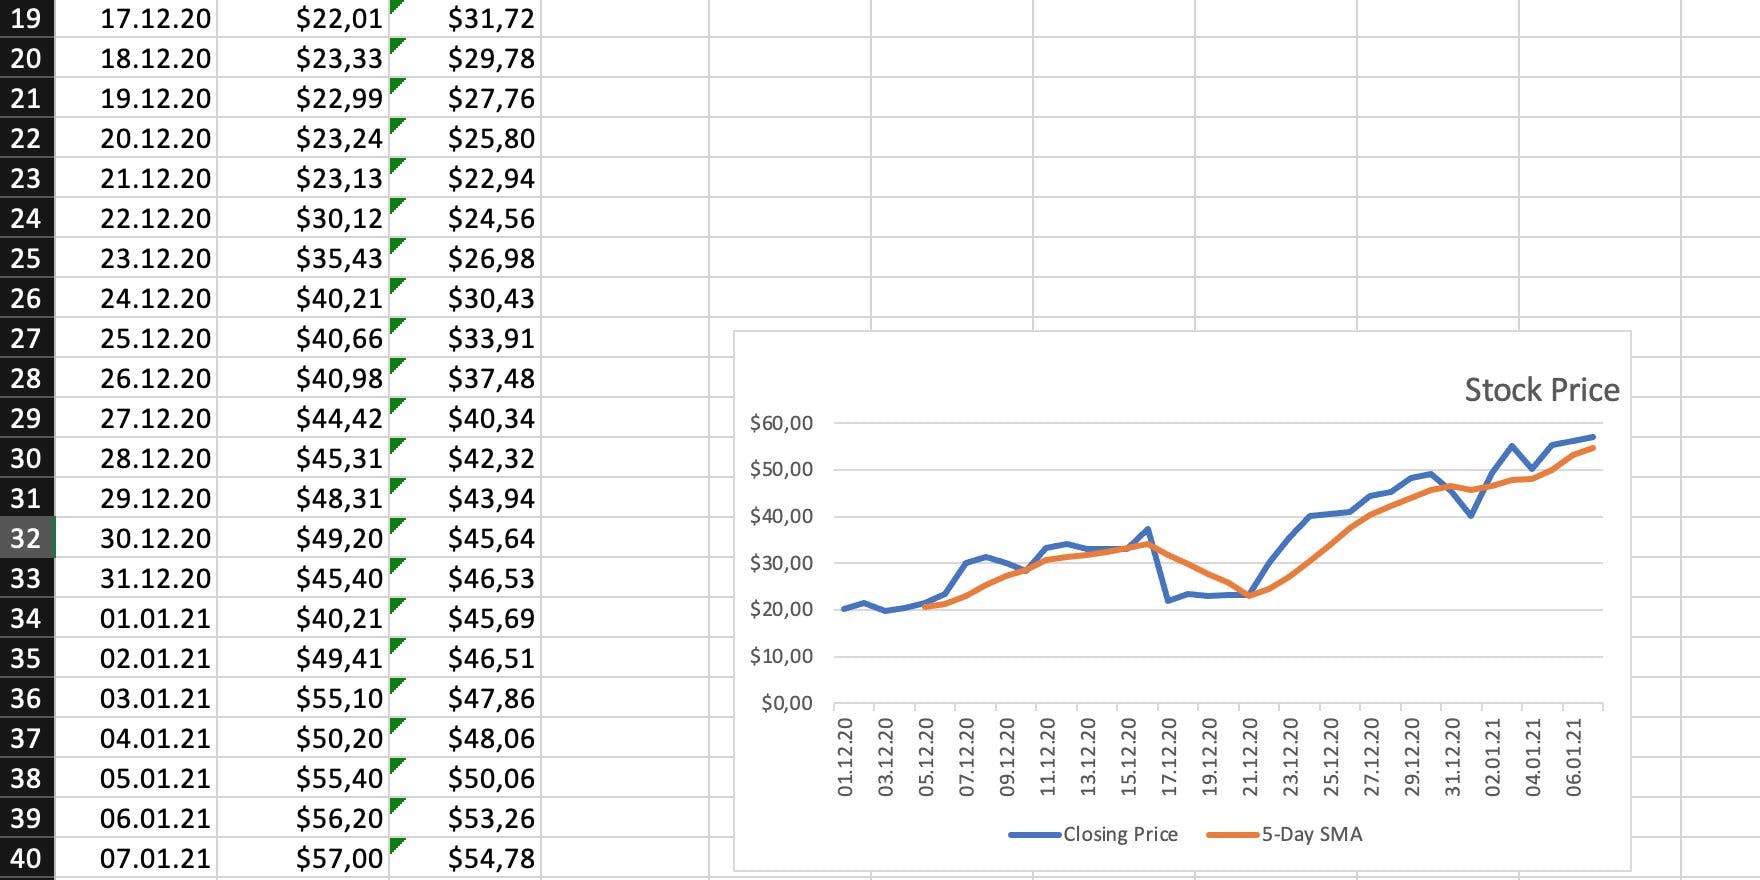
Although the window is pretty short here, you can already see that some noise was filtered out. You could, by looking at the prices, tell that the trend went up, but the moving average makes this more clear.
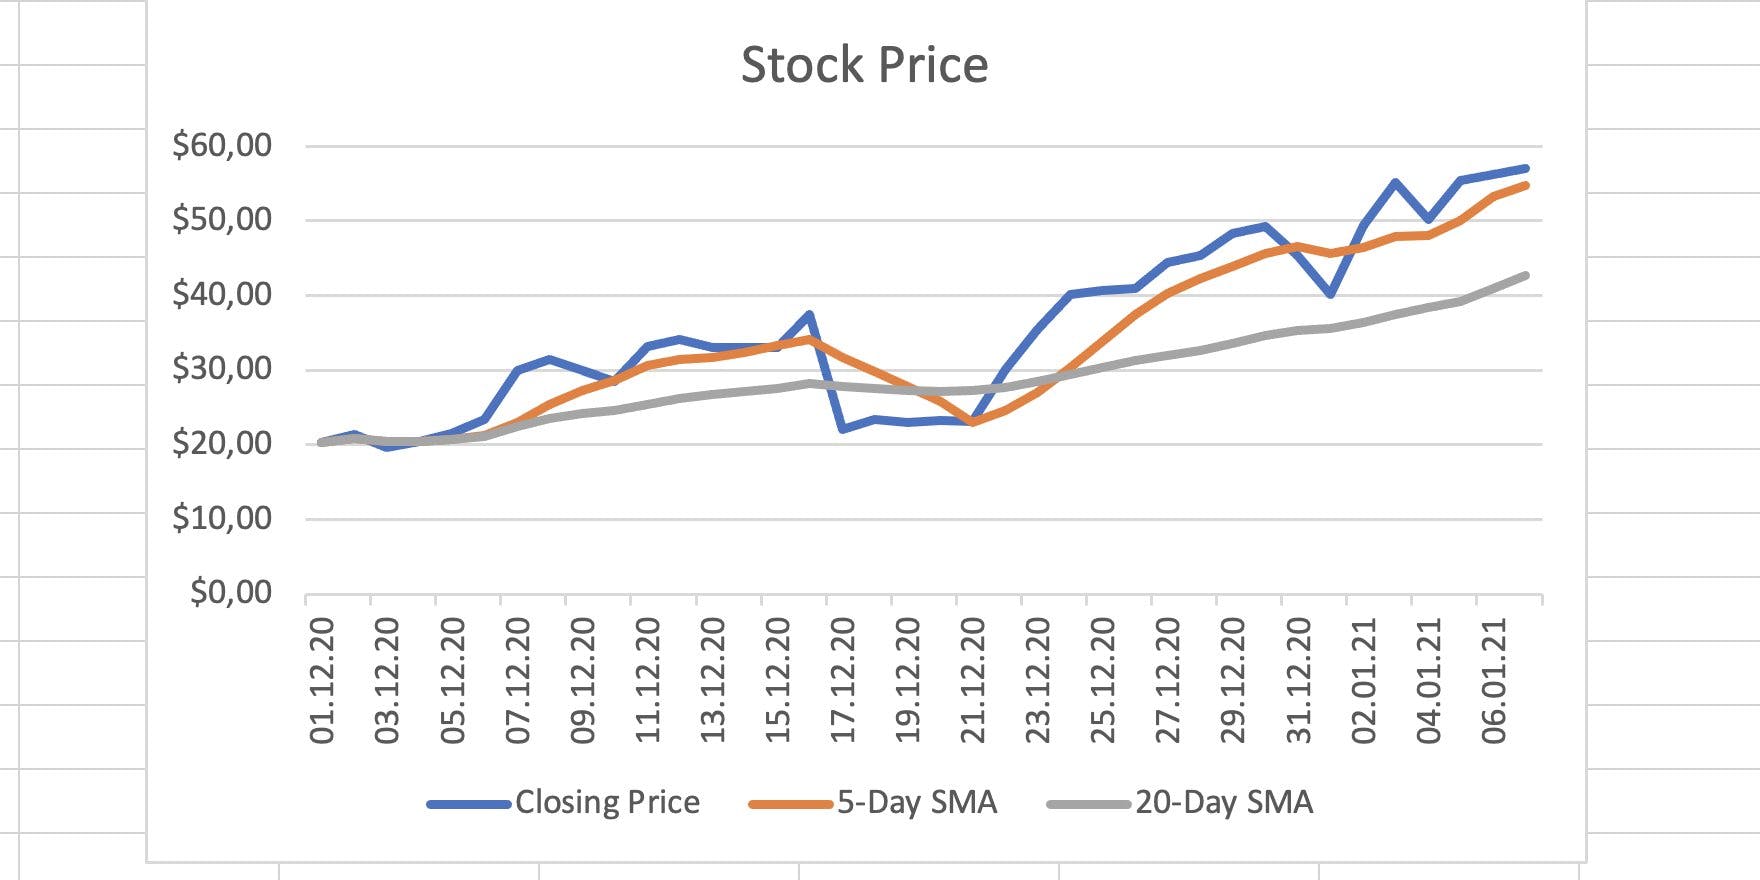
If you calculate a 20-Day SMA, you can see that this one filters out even more noise and shows you the slight upward trend of the stock and even nearly negates the slight drop in the middle of the series.
The SMA is, however, not without issues. There is one important rule in finance:
History is often a bad forecaster.
And what this means is: Looking at the history of stock can usually state nothing about the future. Today's prices are only partially affected by yesterday's. This doesn't mean that finance can't learn from history, but for stock prices, it's a different and difficult story. As the SMA takes into account a lot of "older" prices, it mustn't be mistaken for a good forecast method.
Gladly, the younger the prices, the more you can trust them. And this is where the Exponential Moving Average (EMA) comes into the game.
The Exponential Moving Average (EMA)
The EMA gives more weight to recent prices. As that rule, you read above states: History is often a bad forecaster. The more up-to-date a price is, the better it reflects the reality. You can see the formula for it below.
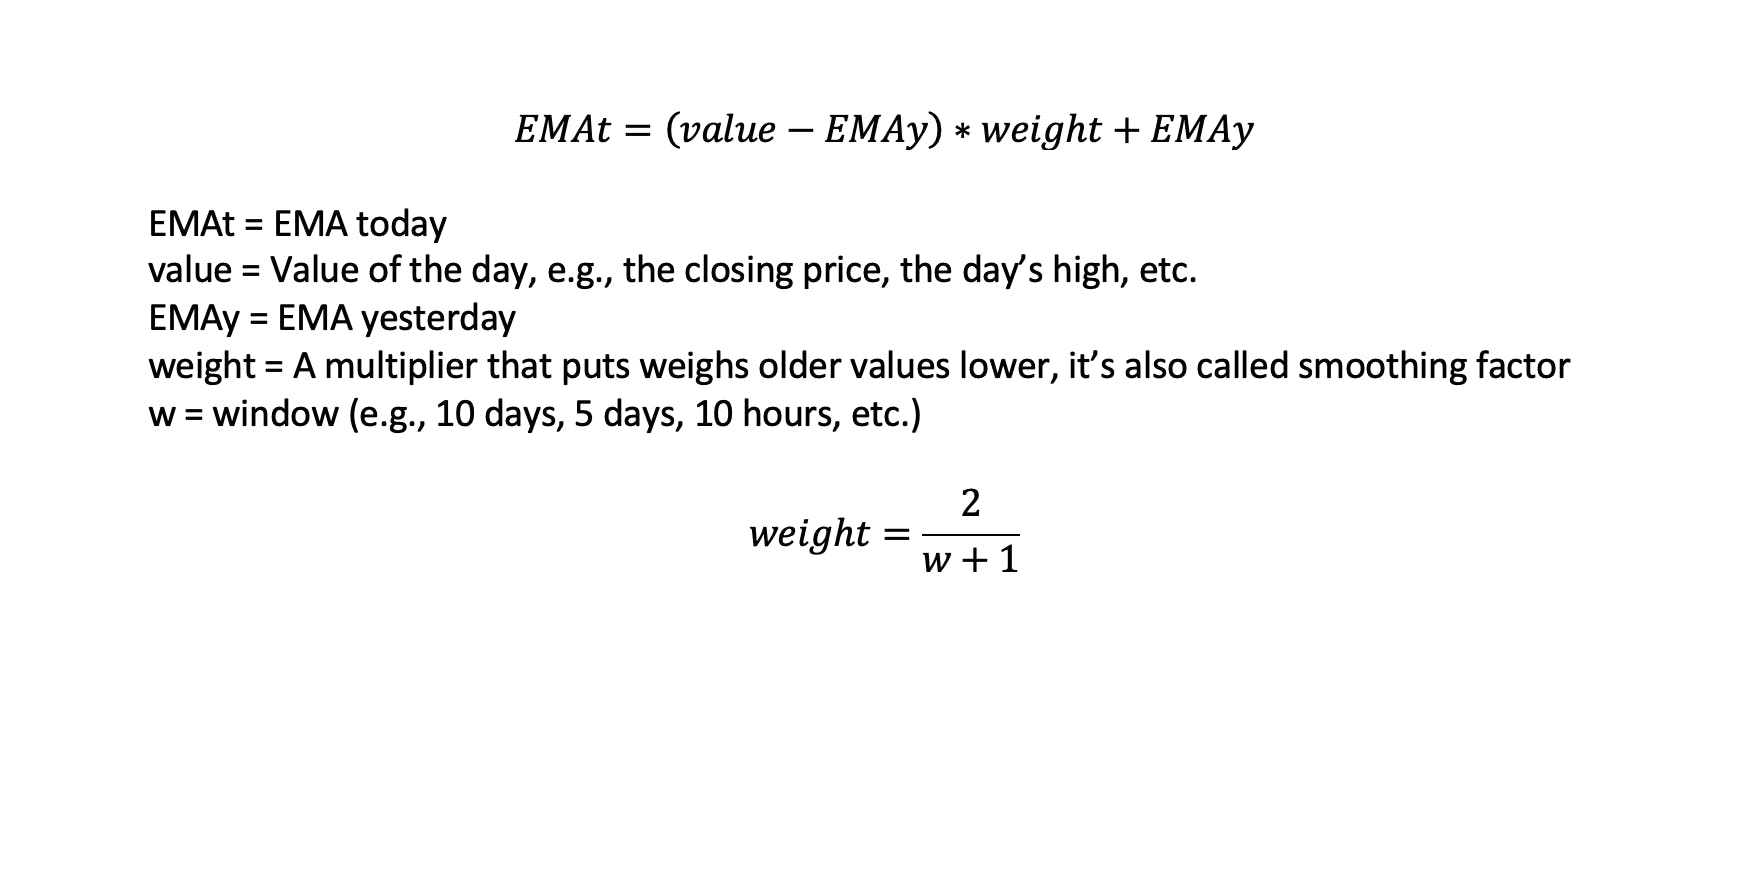
You always need the EMA of the previous day which leads to a small problem. For the first day where you could calculate the EMA, you don't have one for the previous day. This is why you calculate the SMA for the first day, and for the next, you calculate the EMA using the SMA of the previous day as EMAy.
With this knowledge at hand, you can calculate the EMAs for all days, except the first one where you use the SMA. And all that can be plotted so you can analyze the stock of company ABC.
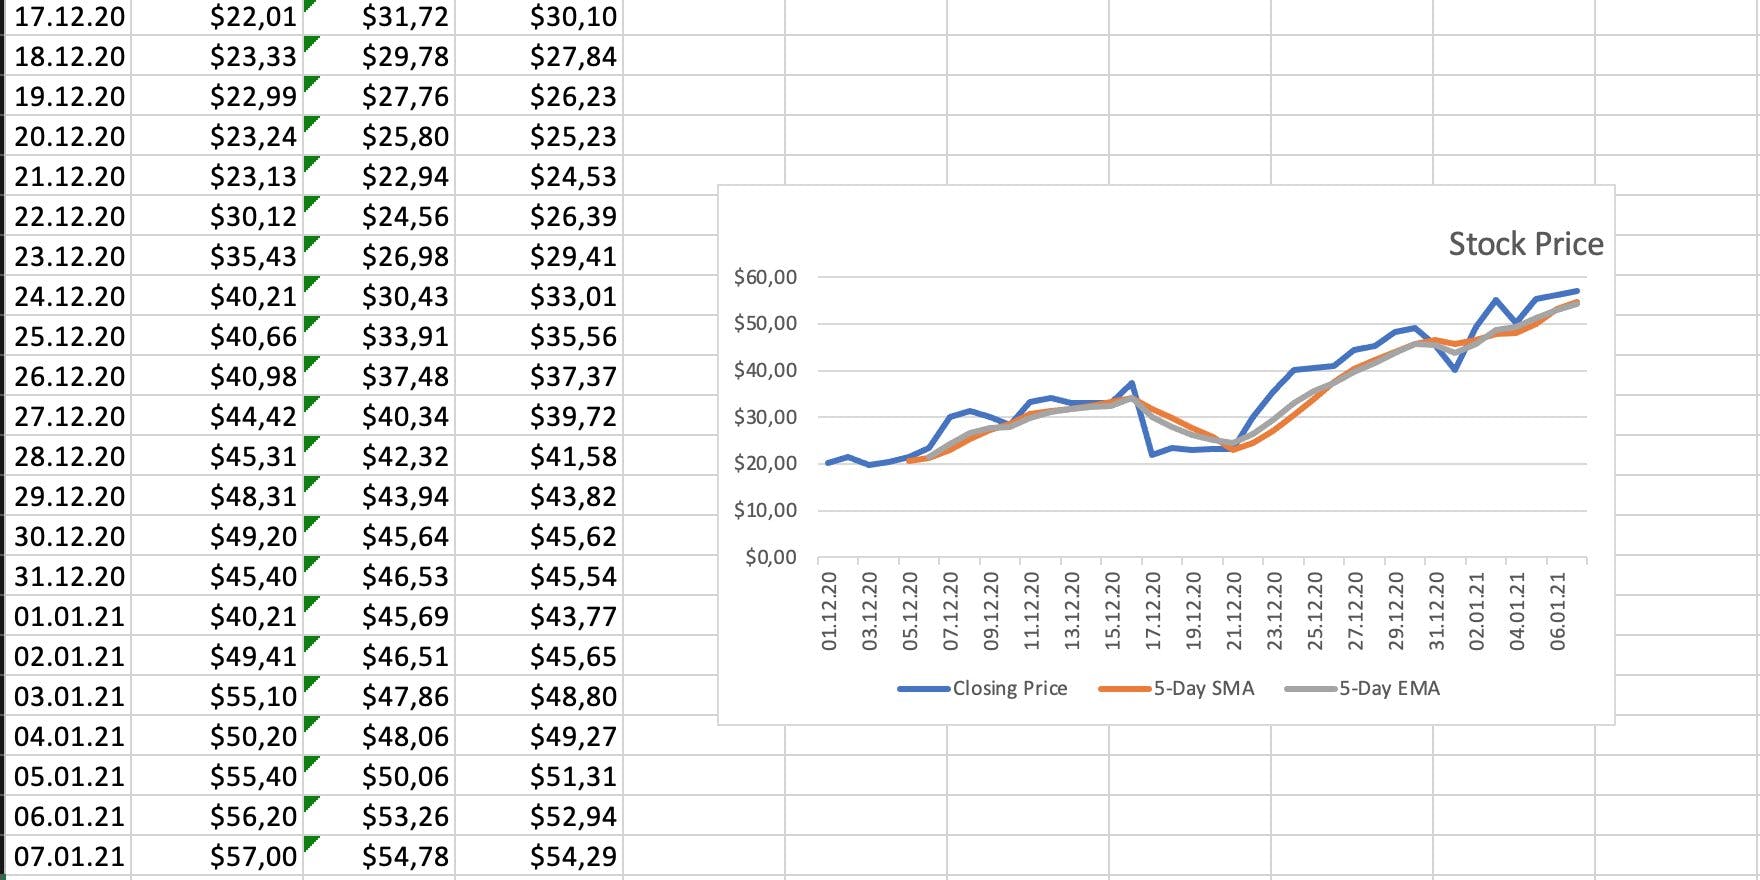
The difference between the 5-day SMA and EMA may not seem that much in this case, but still, the EMA reacts quicker to recent price changes and thus can also send you signals quicker to which you can react.
After all that theory and math, it's finally time for some programming.
Implementing The SMA In JavaScript
Let's start with the simple moving average.
What we need is a function that takes an array of prices, and the window/period the moving average shall be calculated for. In the end, it should return an array containing the SMAs.
function simpleMovingAverage(prices, window = 5) {
  // ???
}
Calculating an SMA makes no sense when there is not enough or no data available at all, so a guard statement makes sense.
function simpleMovingAverage(prices, window = 5) {
  if (!prices || prices.length < window) {
    return [];
  }
}
You then want to loop over the input array, calculating the SMA for window values each. The loop should start at the first index where a calculation is possible and take all previous values necessary.
E.g., If your window is 5, you want to calculate an average from index 0 to 4.
function simpleMovingAverage(prices, window = 5) {
  if (!prices || prices.length < window) {
    return [];
  }

  let index = window - 1;
  const length = prices.length + 1;

  const simpleMovingAverages = [];

  while (++index < length) {

  }

  return simpleMovingAverages;
}
And to make this function complete: Within that loop, calculate the average for the previous index - window elements.
Finally, push the result to an array and return that from your function.
function simpleMovingAverage(prices, window = 5) {
  if (!prices || prices.length < window) {
    return [];
  }

  let index = window - 1;
  const length = prices.length + 1;

  const simpleMovingAverages = [];

  while (++index < length) {
    const windowSlice = prices.slice(index - window, index);
    const sum = windowSlice.reduce((prev, curr) => prev + curr, 0);
    simpleMovingAverages.push(sum / window);
  }

  return simpleMovingAverages;
}
Implementing The EMA In JavaScript
As you need the SMA as the first EMAy, it makes sense to make a small change to the function that calculates it first. You can introduce a parameter that states how many values should be calculated, and that stops the loop when exceeded.
function simpleMovingAverage(prices, window = 5, n = Infinity) {
  if (!prices || prices.length < window) {
    return [];
  }

  let index = window - 1;
  const length = prices.length + 1;

  const simpleMovingAverages = [];

  let numberOfSMAsCalculated = 0;

  while (++index < length && numberOfSMAsCalculated++ < n) {
    const windowSlice = prices.slice(index - window, index);
    const sum = windowSlice.reduce((prev, curr) => prev + curr, 0);
    simpleMovingAverages.push(sum / window);
  }

  return simpleMovingAverages;
}
Like you already implemented for the SMA, it makes sense to implement a guard statement first, so you don't have to do unnecessary work when users pass in unfitting data.
function exponentialMovingAverage(prices, window = 5) {
  if (!prices || prices.length < window) {
    return [];
  }
}
The next part is the same as it already was for the SMA calculation. You need a loop to go over all values within the price array.
function exponentialMovingAverage(prices, window = 5) {
  if (!prices || prices.length < window) {
    return [];
  }

  let index = window - 1;
  const length = prices.length;

  const exponentialMovingAverages = [];

  while (++index < length) {

  }

  return exponentialMovingAverages;
}
Now you can use the adjusted function for the SMA to get your first EMA value. This is the first result, and also a value that you need to access within the loop for the very first calculation of the actual EMA.
function exponentialMovingAverage(prices, window = 5) {
  if (!prices || prices.length < window) {
    return [];
  }

  let index = window - 1;
  const length = prices.length;

  const exponentialMovingAverages = [];

  const [sma] = simpleMovingAverage(prices, window, 1);
  exponentialMovingAverages.push(sma);

  while (++index < length) {

  }

  return exponentialMovingAverages;
}
To access the previous EMA on each iteration, you can make use of the result array that already contains everything you need. And by keeping a separate index that tracks the number of EMAs calculated, you can access the previous result within that array.
function exponentialMovingAverage(prices, window = 5) {
  if (!prices || prices.length < window) {
    return [];
  }

  let index = window - 1;
  let previousEmaIndex = 0;
  const length = prices.length;
  const smoothingFactor = 2 / (window + 1);

  const exponentialMovingAverages = [];

  const [sma] = simpleMovingAverage(prices, window, 1);
  exponentialMovingAverages.push(sma);

  while (++index < length) {
    const value = prices[index];
    const previousEma = exponentialMovingAverages[previousEmaIndex++];
    const currentEma = (value - previousEma) * smoothingFactor + previousEma;
    exponentialMovingAverages.push(currentEma);
  }

  return exponentialMovingAverages;
}
And that's it. That's the whole formula, you learned earlier in this article, implemented in this function. Call it and you'll get an array containing the EMAs for the time series you pass in. This can then be the base to plot a graph from, for further analysis.
Conclusion
A Moving Average is a good way to get a feeling about a trend for prices. It's relatively easy to calculate but still widely used, especially in finance. It is, of course, not the only tool you should use, but one of the first ones, as it has such an impact.
Many (more professional) stock charts usually give you an option to show some form of MA to visually present trends to you and to help you to decide whether to buy, hold, or sell. And especially for that last decision, there are some methods that include the MA. But we will talk about that in another article.
I hope you enjoyed this read and learned a thing or two, and I'd be really happy if you gained something from it.
Thank you for reading, and don't hesitate to comment if you wish to!
Before You Leave
If you like my content, visit me on Twitter. I regularly post content there. It is basically the platform where you will find my content first before it lands on my blog or somewhere else.